The Psychology of Quality and More
|
|
The Psychology of Quality and More |
The Emotional State-Transition Diagram~ David Straker ~
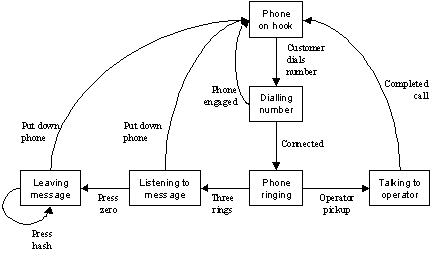
What happens when a customer calls direct into your organisation? They might
get through to you, or have their call redirected through an operator or
perhaps drop into voicemail where they can leave you a message. Or perhaps
they may go through an automated system where they can press various buttons
for other assorted options, such as recorded messages about your products.
This will let you track what the customer might have done and find missing
states, such as what happens if someone else picks up the phone and they
then want to allow the caller to leave a message. But what is happening in
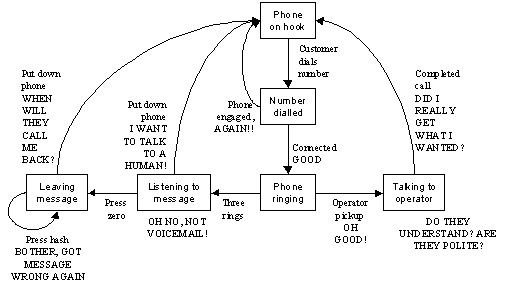
the customer's head? If we add this detail, we start to see a different
picture. Figure 2 shows some of the thinking about the system that could be
going through the customer's mind.
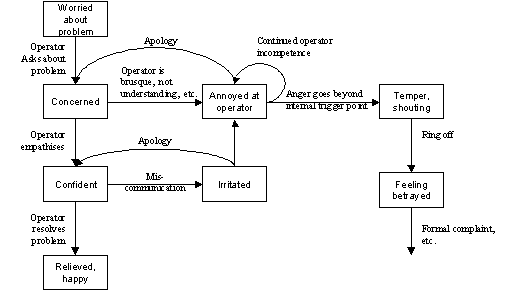
Beyond this, we can use the State-Transition Diagram to map out the
customer's mental states and how triggers in the conversation can lead to
their changing states from positive to negative and back again. For example
if we explore just the box where they are talking to the operator, it could
look something like Figure 3.
A skilful operator will manage the tonality and languaging, empathising and
otherwise pacing and leading the customer to create and maintain a state of
confidence that the customer's problem will be resolved. On the other hand,
a single slip can send the customer into a state of irritation, anger or
betrayal.
In a business situation, this can be used to help highlight special cases
and critical risk points, so that contingency processes such as specialist
defusing and customer recovery actions can be introduced to trigger the
customers back into a calmer, more co-operative state.
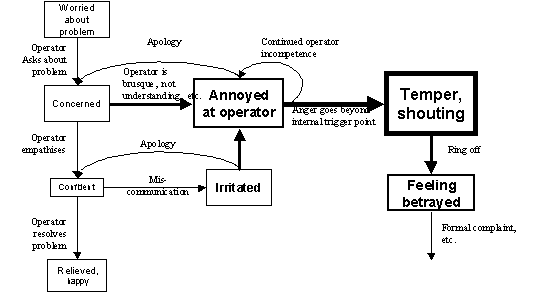
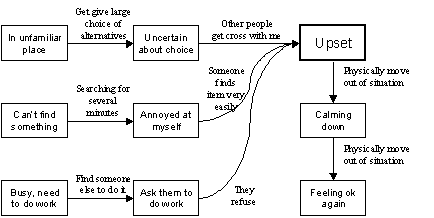
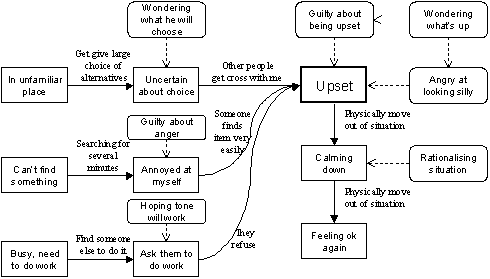
Fig. 5. Client emotion State-Transition The physical diagram can be discussed and changed, an action which is implicitly meta-level in action as the states can be discussed from a higher objective level. Meta-states and self-talk, particularly if they occur at the time of the situation can also be added to the diagram, as in Figure 6.
Fig. 6. Adding Meta-states
State-Transition Diagrams, then, can be used either directly with clients or
off-line for understanding the emotional as well as physical-logical states
within a situation, how they transition to other states and consequently how
the situation can be improved.
|
Site Menu |
|
Quality: | Quality Toolbook | Tools of the Trade | Improvement Encyclopedia | Quality Articles | Being Creative | Being Persuasive | |
|
And: | C Style (Book) | Stories | Articles | Bookstore | My Photos | About | Contact | |
|
Settings: | Computer layout | Mobile layout | Small font | Medium font | Large font | Translate | |
You can buy books here |
|
And the big |