The Psychology of Quality and More
|
|
The Psychology of Quality and More |
Decision Trees (part 1: the basic tree)Quality Tools > Tools of the Trade > 22: Decision Trees part 1
In making decisions, we often are able to assimilate available data and make an acceptable choice based on past experience or advice of others. Sometimes, however, the situation requires a more considered approach, taking into account possible different futures.
How it worksWhen decisions are made, selecting from amongst a set of possible actions, each action has a cost and may lead to a number of alternative consequent events (both good and bad). We thus need a system to weigh up the different alternatives so we can choose the course of action that best suits our purpose.
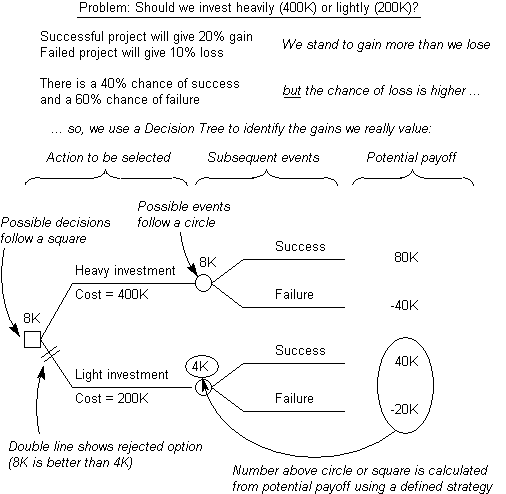
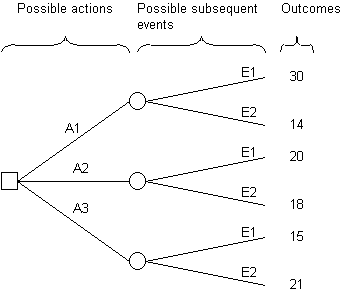
A Decision Tree shows a hierarchy of decision and possible consequent actions as in the diagram below using the following conventions: · Decision points are shown as squares, with possible decisions being considered drawn as lines emanating from the square. A description of the action and its cost may appear on the line. · As events may follow decisions, these are differentiated from the decision point by starting with a circle. Thus lines which emanate from circles are possible different consequences that may result from the decision being taken.
Decision Trees may show a number of cascaded decisions and subsequent events, although space and complexity usually prevents an exhaustive analysis of possibilities.
There are a number of possible strategies which may be used to select from alternative action decisions. These will be described in detail in the next article.
How to do it1. Focus the choices you will make by defining the objective and constraints on the situation. Typically, you will want to maximise something desirable, such as profits or minimise something undesirable, such as waste.
2. List the possible actions between which you need to choose, for example ways to advertise for a new product. Keep this to a short list of feasible actions, rather than brainstorming a wide range of possibilities.
3. List the possible events that may happen after you have acted. These can be dependent events, such as advertising reach or independent effects such as changing market conditions.
4. Draw up a Payoff Table (as below) to determine the value of each decision, should any of the possible subsequent events occur. This will require a common unit of measurement, such as time, return on investment, etc.
5. Draw the basic Decision Tree, showing the actions, events and outcomes from the previous steps, showing actions emanating from squares and events from circles.
6. Identify the prioritisation strategy, which may place different emphasis on things such as risk and potential return. This will be discussed in more detail next time.
7. Calculate the value of each alternative action, according to the strategy being used. This may, for some strategies, require that you identify the probability of the alternative events or consequences.
Next time: Decision trees (part 2: Selection strategies)
This article first appeared in Quality World, the journal of the Institute for Quality Assurance |
Site Menu |
|
Quality: | Quality Toolbook | Tools of the Trade | Improvement Encyclopedia | Quality Articles | Being Creative | Being Persuasive | |
|
And: | C Style (Book) | Stories | Articles | Bookstore | My Photos | About | Contact | |
|
Settings: | Computer layout | Mobile layout | Small font | Medium font | Large font | Translate | |
You can buy books here |
|
And the big |