The Psychology of Quality and More
|
|
The Psychology of Quality and More |
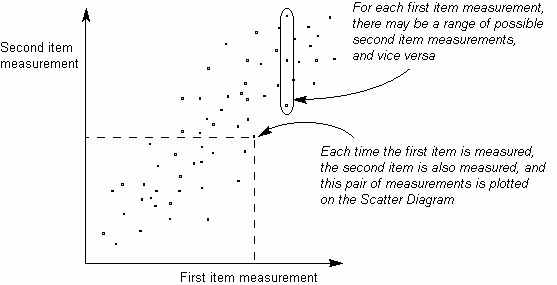
Scatter DiagramThe Scatter Diagram (also sometimes known as a Scattergram or Scatterplot) helps to identify the existence of a measurable relationship between two items by measuring them in pairs and plotting them on a graph, as below. This visually shows the correlation (but not the causal relationship) between the two sets of measurements. The Scatter Diagram is one of the first seven tools.
See also:First seven tools, Correlation, Regression lineToolbook chapter: Scatter Diagram |
Site Menu |
|
Quality: | Quality Toolbook | Tools of the Trade | Improvement Encyclopedia | Quality Articles | Being Creative | Being Persuasive | |
|
And: | C Style (Book) | Stories | Articles | Bookstore | My Photos | About | Contact | |
|
Settings: | Computer layout | Mobile layout | Small font | Medium font | Large font | Translate | |
You can buy books here |
|
And the big |