The Psychology of Quality and More
|
|
The Psychology of Quality and More |
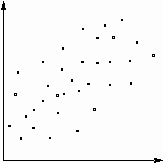
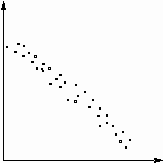
CorrelationCorrelation is the degree to which two sets of data are related and may be mathematically calculated with the correlation coefficient (aka. coefficient of correlation). The simplest way of visualizing the correlation is with a Scatter Diagram, where perfect correlation is a straight line and no correlation is a random cloud of points. No correlation is a positive result: it tells you clearly that the two sets of data are not related. The must frustrating picture is when there is a weak correlation which only says that there might be a weak or distant relationship.
Positive correlation occurs when increasing one set of data leads to a corresponding increase in the second set of data. Negative correlation is when an increase in the first set leads to a predictable decrease in the second set.
It is a trap to assume that because correlation is found that there is a causal relationship. For example, the sales of ice-cream correlate (i.e. go up and down with) people drowning. One does not cause the other. In this case, they both have a common cause: sunny weather. At best, correlation can indicate a potential relationship, which may be confirmed by other methods. See also: |
Scatter
Diagram, Correlation coefficient,
Correlation table
Site Menu |
|
Quality: | Quality Toolbook | Tools of the Trade | Improvement Encyclopedia | Quality Articles | Being Creative | Being Persuasive | |
|
And: | C Style (Book) | Stories | Articles | Bookstore | My Photos | About | Contact | |
|
Settings: | Computer layout | Mobile layout | Small font | Medium font | Large font | Translate | |
You can buy books here |
|
And the big |