Control Chart: Practical variations
The Quality Toolbook >
Control Chart > Practical variations
When to use it | How to understand it |
Example | How to do it | Practical
variations
<-- Previous |
Next
-->
Practical variations
- Another significant set of points that can be identified on a Control Chart
is a bias, where more points that might be expected are on one side of
the center line. They need not be sequential, as in a shift. Significant sets
are:
- Ten out of eleven consecutive points on one side of the center line.
-
Twelve out of fourteen consecutive points on one side of the center line.
-
Fourteen out of seventeen consecutive points on one side of the center line.
-
Sixteen out of twenty consecutive points on one side of the center line.
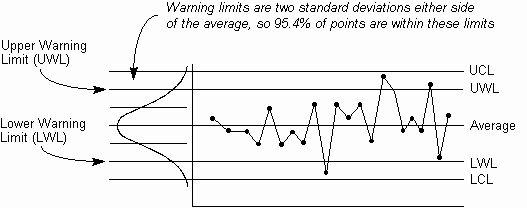
- Draw one additional horizontal line two standard deviations away from either
side of the central line (these occur at two-thirds of the way towards the
control limits for most Control Charts - this excludes range charts, which do
not have a symmetrical distribution). These lines are called the Upper
Warning Limit (UWL) and the Lower Warning Limit (LWL), and catch
additional sequences that may indicate out-of-control situations. Warning limits
are illustrated below in Fig. 1.
- Additional sequences (to those in Table ) that may now indicate
out-of-control situations include:
- Two out of three consecutive points
are between a warning limit and the corresponding control limit.
- Three
out of seven consecutive points are between a warning limit and the
corresponding control limit.
- Five or more points which are all
increasing or decreasing (a trend) and which cross a warning limit.

Fig. 1. Additional limit lines
- Draw a third and fourth line in addition to the warning limits, at one
standard deviation either side of the central average line. Additional sequences
to check for now include:
- Fifteen consecutive points which lie entirely between these two lines.
-
Four or more consecutive points beyond one of these lines.
- If the cost of looking for problems in the process is high and the
consequence of problems is not serious, then wider control limits may be used,
for example at four standard deviations from the central average line.
Conversely, control limits may be tightened, for example to two standard
deviations, if the cost of looking for problems is low and the consequence of
problems is serious.
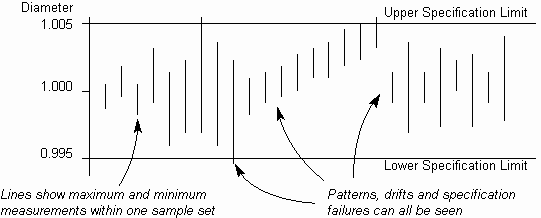
- A Multi-Vari Chart (Fig. 2) is a simple way of showing the ranges of each
of a set of samples, where the range is shown by a vertical line, as
illustrated. Each line typically represents between 3 and 5 measurements.
Specification limits are used instead of control limits, so it can be seen
whether any items are getting near or exceeding these constraints.

Fig. 2. Multi-Vari Chart
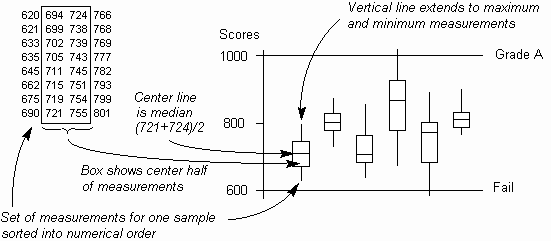
- A variation on the Multi-Vari Chart is the Box Plot (Fig. 3), where the
simple line is enhanced with a box to show the center 50% of measurements, with
a line to show the center measurement (the median). Each sample is thus visually
divided into four quartiles. This requires a number of measurements per
sample (typically at least 25).
A variation on this is to change the box width in order to show any change in
sample size.

Fig. 3. Box Plot
<-- Previous |
Next
-->
|