Decision Tree: How to do it
The Quality Toolbook >
Decision Tree > How to do it
When to use it | How to understand it |
Example | How to do it | Practical
variations
<-- Previous |
Next -->
How to do it
- Identify the objective of the decision-making process. Typically this involves maximizing something desirable, such as profit, sales or satisfaction, or reducing something undesirable, such as defects, time taken or scrap.
- Identify constraints on the decision making. These will effectively act as additional sub-objectives, and can be used to prevent the objective being achieved at the expense of other goals. For example, an objective to increase short-term profit could be fulfilled at the expense of longer term investments, unless some reasonable constraints are defined.
- List the set of possible actions to be considered as ways of achieving the objectives. For example, if the objective is to increase productivity, options may include new machinery and revised working practices.
This should be a relatively short list, typically of between two and four actions, particularly if the Decision Tree is to be multi-level, in order to minimize the complexity of the final Tree. This may start as a longer list which is first whittled down to a few strong contenders amongst which the best choice is difficult to identify.
- List the possible events that may follow on from each of the actions identified in step 3. Limit this to a few events which constitute all possibilities, for example, 'sales increase', 'no change' and 'sales decrease'.
Events may be dependent or independent, as follows:
-
Dependent events are a direct consequence of performing an individual action, and are thus different for each action. For example, the action of increasing furnace temperature to reduce firing time may also result in more scrap through cracked pots. -
Independent events do not depend on the actions, and are just as likely to happen whatever action is taken. For example, the dynamics of the national economy are not affected by an investment in a new product, yet may still affect future sales.
- For each action (step 3) and event (step 4), determine a value that describes the gain that will be achieved if this combination occurs. This is commonly called the payoff or outcome and may be shown in a payoff table, as illustrated
in Fig. 1.
.
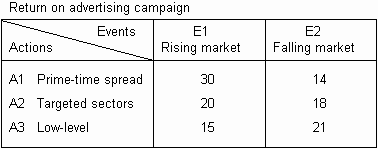
Fig. 1. Payoff table This measurement will require a common unit, related to the original objective (step 1). This is typically a financial measure, but can be others, such as time, efficiency, etc. It can be useful to include the cost of performing the actions in this figure, rather than just using the return gained. Thus 'profit' or 'return on investment' may be better than simple 'revenue'.
- The basic Decision Tree can now be drawn, as in Fig. 2. Start with a small square on the left of the page with lines radiating for each possible action (step 3). At the end of each line, draw a small circle with one line coming out of it for each possible subsequent event (step 4). At the end of each of these lines write in the payoff (step 5). Actions and events may either be written in full or as codes from a table, such as
in Fig. 1. The final diagram will look something like Fig. 2.

Fig 2. Basic Decision Tree - Decide how to select the best actions by using a defined strategy to determine the 'real' value of the payoffs identified in step 5. Common strategies are outlined below and shown in the illustration further below, which shows how different strategies can result in different activities being selected.
-
Maximin, which looks for the best worst-case situation, and is the 'pessimist's choice'. Thus, in
Fig. 3, A2 is selected.
-
Maximax, which seeks to maximize to profit by selecting the option with the highest potential return. It can thus be viewed as the 'optimist's choice'. Thus,
in Fig. 3, A1 is selected.
-
Minimax Regret or Opportunity Loss, which takes the conservative approach of seeking to minimize the loss incurred should the best action not be taken. Thus,
in Fig. 3, A1 is selected.
-
Expected Monetary Value, or EMV, includes the concept that an item which is less likely to occur is also worth less. This is a very common strategy, based on the sound statistical and financial principle that effective value is equal to actual value multiplied by probability of occurrence. Thus, in
Fig.3, A2 is selected.
-
Expected Opportunity Loss, which combines the Minimax Regret with the statistical principles of EMV to give a conservative statistical approach. Thus,
in Fig. 3, A3 is selected.
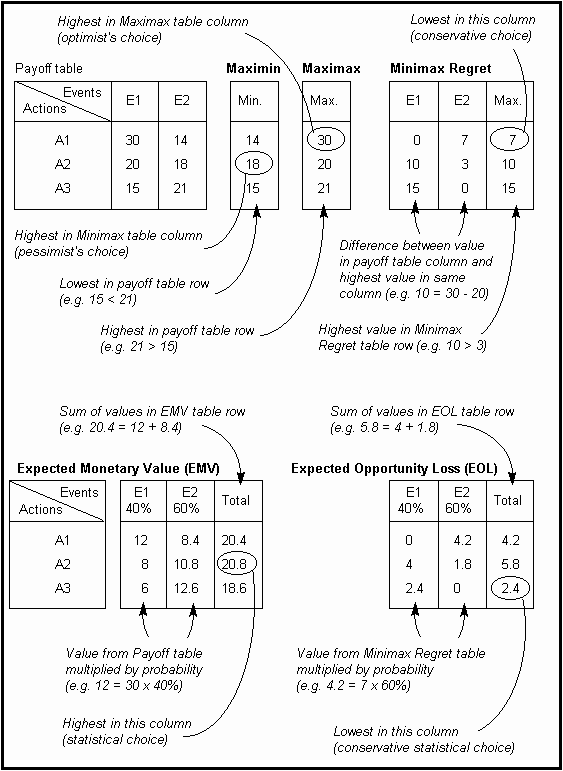
Fig. 3. Calculations for alternative decision strategies
- If the strategy calls for it (e.g. if it is EMV or EOL), determine the probability of each action/event combination. It can be very difficult and expensive to get accurate figures, and decisions may need to be made on the value of accuracy. For example, it may be worth spending thousands on a market survey when changing a product line, but a less accurate estimate may be adequate when deciding what lockers to put in a changing room.
Ways of determining these figures include:
-
Asking people in surveys of customers, employees, etc.
-
Measuring aspects of processes, such as time taken, defects, etc.
-
Identification and extrapolation of previous trends.
-
Investigating variation.
Probability figures are usually shown as being between 0 (no chance) and 1 (certainty), although percentages may be more familiar and can be used instead as they are directly equivalent. Event probabilities, particularly for dependent events, can be shown in a table, as illustrated
in Fig. 4.
The final figures may be written on the Decision Tree diagram. Put them in parentheses underneath the appropriate event lines.
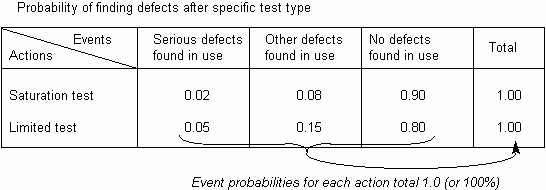
Fig. 4. Probabilities of dependent events
- Calculate the value of each action, using the strategy selected in step 7, and write this above the circle at the end of the action's branch on the tree drawn in step 6. For example, if an Expected Opportunity Loss
(EOL) strategy is being used, as in Fig. 3, then the tree from Fig. 2 will appear as illustrated
in Fig 5.
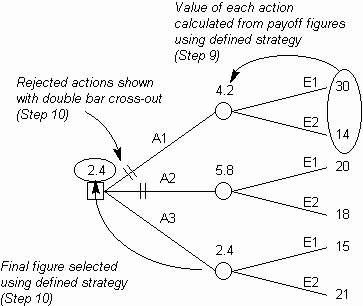
Fig. 5. Adding action values (for EOL strategy) - Select one of the values from step 9, again using the defined strategy of step 7 (typically it will be the largest or smallest value). Write this value above the square box where the action branches meet. This indicates the action selected, so cross out the rejected actions with double lines, as illustrated
in Fig. 5.
- If required, the tree may be extended with another set of decisions, using steps 3 to 10. This caters for consideration of what possible actions and events might occur, if any or all of the events in the first stage occur. This is typically used in complex situations where there is no payoff before several sets of actions and events. In this case, delay calculation until the tree is complete and then ripple back the values in the same way as step 9. The result will be a multi-level Decision Tree, as illustrated
in Fig. 6.
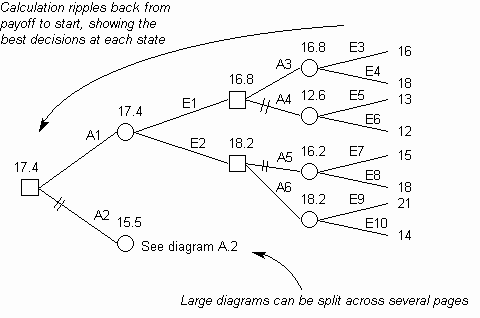
Fig. 6. Multi-level Decision Tree - Carry out the selected actions and check the events and payoff occur as expected. If they do not, identify causes for another round of process improvement.
<-- Previous |
Next -->
|