Matrix Diagram: Practical variations
The Quality Toolbook >
Matrix Diagram > Practical variations
When to use it | How to understand it |
Example | How to do it | Practical
variations
<-- Previous |
Next
-->
Practical variations
- When relationships act only in one direction, for example where one item influences another, use arrows in cells to show the direction of the relationship.
- A common way of generating and organizing the lists for comparison in the matrix, particularly when a fair degree of detail is required, is to use a Tree Diagram. Space can be saved on the Matrix Diagram by removing the hierarchy links and compressing the tree elements.
- The matrix may be extended in either direction to include other comparisons which use the same lists, for example to determine how well competitive products satisfy customer requirements.
- Items within the same list may be compared by using a triangular half-matrix, as below. This comparison may include both positive and negative correlation to show where list items cooperate or conflict. A negative correlation occurs where the presence or increase of one item reduces the value or effect of another item–this may require trade-offs to be made between these items.

Fig. 1. The Quality Function Deployment (QFD) House
- Where pairs of lists of numbers are generated, it may be feasible to show correlation between them by using a Scatter Diagram.
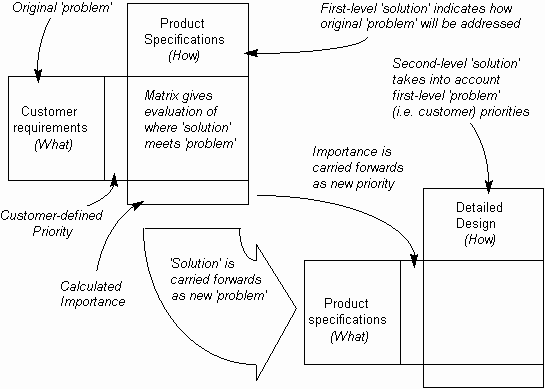
- In the product development process there is a sequence of transformations, such as requirements to specification, specification to design, design to fabrication, specification to tests, etc. It is easy for the customer requirements to become lost in these chains. Quality Function Deployment (or QFD) addresses this problem by using a matrix at each transformation point to map forwards what is often called the 'voice of the customer'.
This is achieved by turning the columns of one matrix into the rows of the next matrix, as shown below, with the importance being carried forward as priority.

Fig. 3. Cascading Matrix Diagrams
<-- Previous |
Next
-->
|