Relationship Diagram: Practical variations
The Quality Toolbook >
Relationship Diagram > Practical variations
When to use it | How to understand it |
Example | How to do it | Practical
variations
<-- Previous |
Next
-->
Practical variations
- Use adhesive memo notes instead of cards. These stay where they are put, and
can be used to sort the notes vertically, on a whiteboard or flipchart. Their
disadvantage is that they are not as durable as card.
- If cards are
used, stop them from moving by attaching them to the organization area, either
with reusable adhesive pads or by using a pinboard.
- Instead of using
cards, draw the diagram directly. This can result in a less tidy first diagram,
particularly in a complex, uncertain situation, but requires less resource. It
can be helped by first writing the causes as a list, then crossing them off as
they are added to the diagram.
- Display a list of items that may help
the team to identify causes. These may be taken from (and even displayed as) the
Cause-Effect Diagram. For example, manpower, machines, methods, materials, (the
'4 Ms') money, management, plans, customers. These may be broken down further
into specific items, such as individual roles, machines, etc.
- Indicate
differing confidence cards in relationships. For example, where there is a
mixture of measured, unmeasured and speculative relationships, show the
difference by circling those which are measured and underlining those which are
unmeasured.
- Start with a desired effect, and determine what
must be done to cause it by asking the question: 'What must be done to make this
happen?'.
- Use the diagram to determine what may be caused by a
planned action, using the question: 'What could happen as a result of this?'
-
Use different shaped boxes to indicate different items.
- Show groups of
related items by putting dotted lines around them.
- Include items, other
than problems and causes, which affect the problem, such as documents.
-
Use it to show the relationships between any items. For example, the
boxes may be people, and the arrows indicate where one person influences
another's decisions.
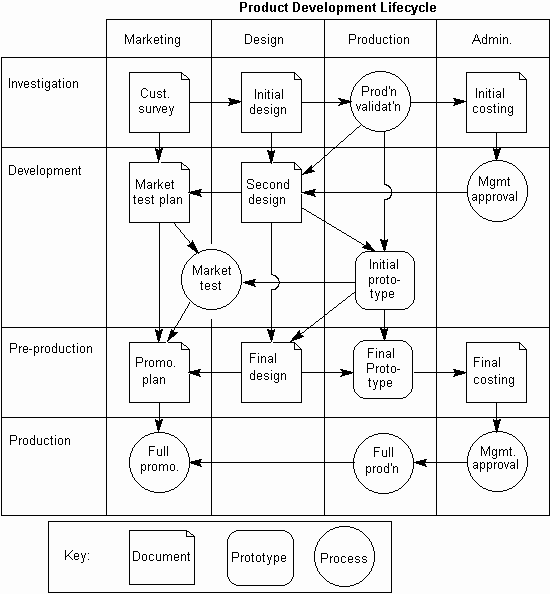
- Use it to show relations between items within a
process, as in Fig. 1. This is an informal way of mapping
processes which is often called a Block Diagram. The question may thus
be: 'What happens next?'.
A typical use is for understanding the top level of a process. Each process
in this diagram may then be detailed further ('zoomed into' or 'exploded') in
subsequent diagrams. Typically these will be more Block Diagrams or Flowcharts.

Fig. 1. Block Diagram
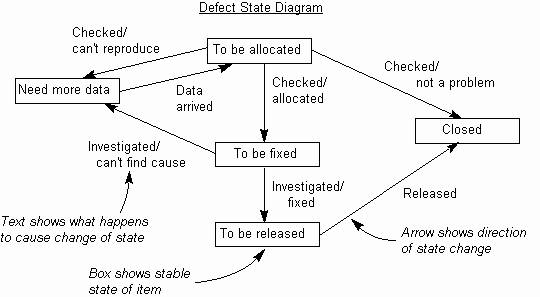
- A State Transition Diagram (or Finite State Diagram) is used
to describe a type of process where an item passes between a number of stable
'states', as below. It is useful for describing specific parts of processes
which take this form.
The relationship between items is in terms of the stimulus that causes the
change in state and the action that is taken after the stimulus is recognized,
in order to complete the state change.

Fig.
2. State-Transition Diagram
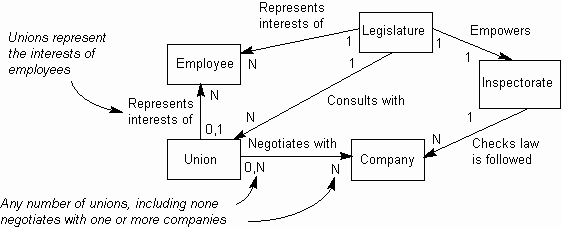
- An Entity-Relationship Diagram shows the relationship between
individual items, including the cardinality of each relationship (i.e.
how many of each item may exist), as below.

Fig. 3. Entity-Relationship Diagram
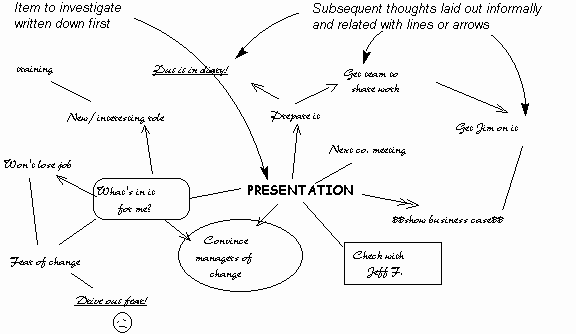
- A Mind Map or Spider Diagram (as below) is an informal
diagram which can be used in individual thinking or Brainstorming to help build
and relate individual items. This starts with the main problem at the center of
the page, and has related items spread around it and connected with lines and
arrows.
There are few formal rules, as the objective is to assist in thinking, and it
may be adapted to suit the individual, for example by using annotations,
doodles, shapes and color to express elements of the problem and emboldening,
dotting or drawing wavy arrows to indicate the certainty of links.

Fig. 4. Mind Map
<-- Previous |
Next
-->
|