Tree Diagram: Practical variations
The Quality Toolbook >
Tree Diagram > Practical variations
When to use it | How to understand it |
Example | How to do it | Practical
variations
<-- Previous |
Next
-->
Practical variations
- The diagram may be built vertically, on a flipchart or whiteboard, by using adhesive memo notes.
- Cards may be dispensed with and the diagram drawn directly on a flipchart or whiteboard. This may be quicker, but it can get untidy if the cards need rearranging or a parent has more children than expected, and families crush into one another.
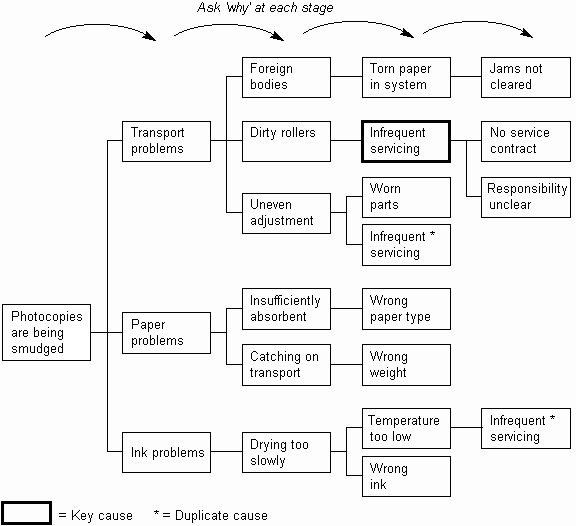
- A Why-Why Diagram is a Tree Diagram where each child statement is determined simply by asking 'why' the parent occurs, as below. It is thus very similar in use to a Cause-Effect Diagram, and techniques may be borrowed from Cause-Effect Diagram usage. Its simplicity can make it useful in less formal situations.
- Winner Analysis
uses a Why-Why Diagram to find out why an action either went wrong or went surprisingly right. Lessons learned are used to help improve future situations.

Fig. 1. Why-Why Diagram
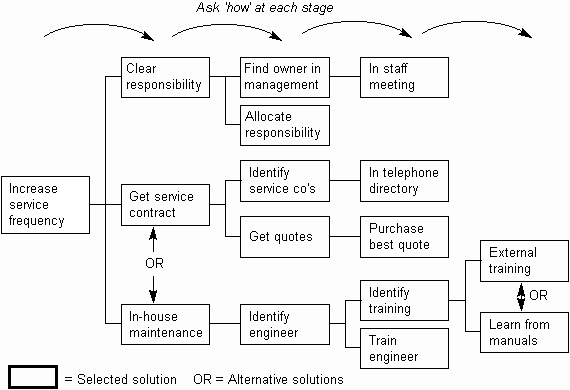
- A How-How Diagram is a Tree Diagram where each child is determined by asking 'how' the parent can be achieved, as
below . It is thus useful for creating solutions to problems.
The Why-Why and How-How Diagrams together make a very simple toolset for finding causes of and solutions to problems.

Fig. 2. How-How Diagram
- Cards containing statements of special note may be marked differently, with asterisks, underlining, etc. Notable cards include key problems, duplicate cards, leaves which are broken down further elsewhere, statements which are explained in more detail elsewhere,
etc.
- Although children usually combine to make up their parent, it is also possible that they form a set of alternatives. Where this is done, it should be made clear, for example by writing 'or' between cards. An example can be seen in
in the diagram above. Where there is a complex combination of 'and's and 'or's, the symbol set used in
Fault Tree Analysis may be applied.
- At each level of breakdown, question each bottom-level card and only break down further those cards that look like yielding useful information. This saves time, but could result in significant areas being missed.
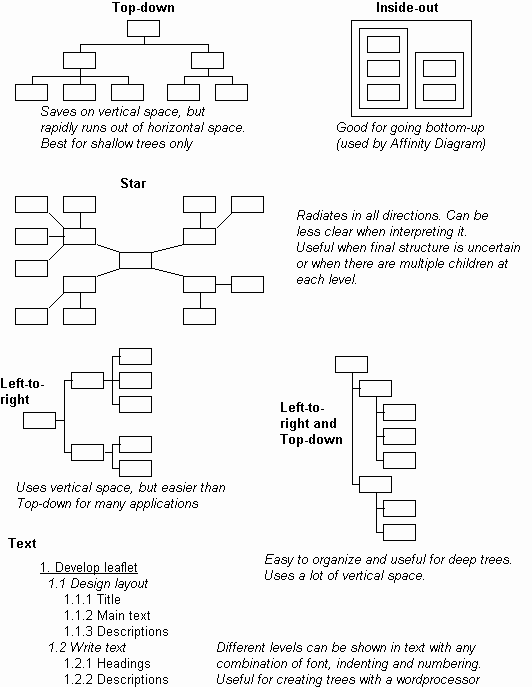
- There are a number of different ways that a Tree Diagram can be displayed, as shown below.

Fig. 3. Different shapes for Trees
- A Work Breakdown Structure (WBS) is a Tree Diagram that breaks down a task into allocable units. The bottom-level leaves may thus have individual people and resources allocated to complete these tasks, complete with estimations of effort required. The sum of the effort and resource in all leaves thus gives the total cost of the overall task.
Computer-based 'project management tools' often combine work breakdown structures with Activity Network-style links to enable complex tasks to be designed and computed such that they may be completed in the shortest possible time.
<-- Previous |
Next
-->
|