Activity Network: Practical Variations
Quality Toolbook >
Activity Network > Practical Variations
What it's for |
When to use it | How to understand it |
Example | How to do it |
Practical
variations
<-- Previous |
Next -->
Practical variations
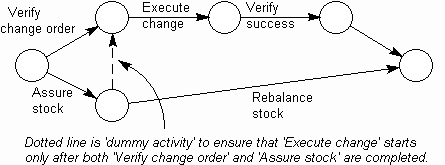
- The Activity-on-Arrow Diagram, as in Fig. 1, reverses the style of Activity-on-Node Diagram shown above, with tasks being represented by
arrows. The actual style used is often a simple matter of taste, although the activity-on-Node diagram lends itself better to the use of cards, and does not need dummy activities (which appear as dotted lines and have no name or duration).

Fig. 1. Activity-on-Arrow Diagram
- Where tasks are related, as in Tree Diagram families, it can be useful to number them
(as Fig. 2) or otherwise indicate their relationships (for example, by naming their parents). Now when the cards are laid out within a network, the original tree structure can still be seen.

Fig. 2. Numbering tasks
- In large projects, where there can be hundreds of tasks, it can be useful to break up the plan into independent pieces. To keep this easy to manage, inter-plan dependencies should be minimized or eliminated.
The sub-plans can either be a set of sequential plans, where one is completed
before the next is started, or nested plans, where a single task in a
'high-level' plan is exploded into a complete sub-plan. Nested plans are
particularly easy to do when building plans off Tree Diagrams, with the
high-level branches forming the top-level plan and the sub-plans containing the
lower level tasks.
- The Delphi Method is a method of gaining consensus within a group, which may be used to agree on task duration estimates. This is performed by first asking for task estimates, then sending a summary of responses back out to the team members, inviting them to modify their views in light of this feedback. This is repeated until sufficient consensus is reached.
A simple method of finding a 'middle point' from the final set of estimates is to use the following formula:
'Middle' = (Lowest response + (4 * Average response) + Highest response) / 6
<-- Previous |
Next -->
|