Flow Process Chart: How to do it
The Quality Toolbook >
Flow Process Chart > How to do it
When to use it | How to understand it |
Example | How to do it | Practical
variations
<-- Previous |
Next -->
How to do it
- Define the objective of mapping the process, for example to find a solution to a particular problem.
- Identify the process to be charted. It should be possible to name it, to know the start and stop points and to identify all materials, tools and other item used in it. The actual charting may be focused on one of three possible aspects of the process:
People: Charting the actions of people within the process.
Materials: Charting the movement and use of specific materials within the process.
Machines: The use of machines and other tools in the process.
- Make sure the person whose process is being charted is comfortable with the charting process being used. It is usually desirable that they are intimately involved in the whole improvement project.
- Identify the symbol set that is to be used. The table
previously shown gives the most common set, but other symbols may be used.
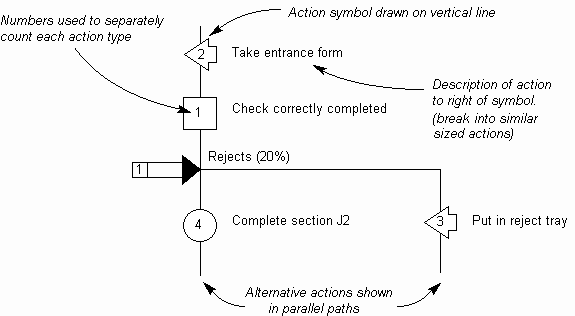
- Record the steps of the process as they happen, starting at the top of the page and putting the action symbol on a vertical line with a brief description of the action to the right. Make the description complete enough to enable an unambiguous understanding of what is being done, but without being too verbose. Other points to consider include:
- Where alternative or simultaneous actions may take place, show this by splitting the diagram into two or more vertical lines,
as in the illustration, and annotate the diagram accordingly.
- Look for consistent sized and self-contained 'chunks' of action. A chunk can be anything from inserting a screw to rebuilding a furnace, but both should not appear in the same chart! The chunk size selected will depend on the overall process being charted.
- It is common to put numbers in each action symbol, counting each action type. Thus, the first operation circle contains a '1', the second circle (wherever it occurs) contains a '2', and so on.
- Aim to make the process easier to read afterwards by fitting it within one page (although more may be needed if a detailed analysis is being done).
- If recording the chart as the process is being enacted, rather than by discussion, try watching it again a few times to check that it is performed consistently. If not, use the most common approach for the main diagram, and consider doing different charts for different actions - one of them may be better than the others.
It is also useful to review the chart with people involved, to ensure it is an accurate representation and to help gain their agreement and acceptance of any subsequent changes.

Fig. 1. Building the Flow Process Chart
- Use the final diagram for the objective identified in step 1.
<-- Previous |
Next -->
|