Cause-Effect Diagram: How to do it
The Quality Toolbook >
Cause-Effect Diagram > How to do it
When to use it | How to understand it |
Example | How to do it | Practical
variations
<-- Previous |
Next -->
How to do it
- Form a small team of people to work on the problem. Ideally, their knowledge and skills will be complementary, to give a broad but expert group. If it has not been already defined, meet first to define the key symptom or effect of the problem under scrutiny. Aim for a brief, clear phrase which describes what is happening to what, such as, 'Low sales of MkII Costor'.
Make sure that only a single effect is described, as this may result in several sets of causes. For example, an effect of 'damp and dirty conditions' could have different causes of dampness and of dirt.
- Write down the key effect or symptom at the center-right of the page (or whiteboard or flipchart, if you are doing it in a group), and draw a spine horizontally from it to the left.
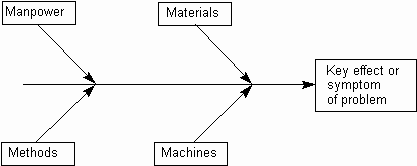
- Draw the main cause area 'ribs' (typically around four to six), one for each of what appears to be the primary cause areas. If these are uncertain, then the 'Four Ms' (Manpower, Methods, Machines and Materials) provide a good starting point, as illustrated
in Fig. 1.
In these gender-free days, an exact alternative is the four Ps
(People, Processes, Plant and Parts).
 Fig.
1. The default 'Four Ms' - Use Brainstorming to build the diagram, adding causes or cause areas to the appropriate ribs or sub-ribs as they appear.
If a cause appears in several places, show the linkage by using the same capital letter next to each linked cause, as illustrated.
Beware of adding 'causes' which are actually solutions. These often are expressed as a negative; further consideration may find a truer cause. For example, a better cause than 'no heating' may be 'low ambient temperature', as it opens up the possibility of additional practical solutions, such as 'installing insulation'.
Beware also of things which are knock-on effects, rather than causes, e.g. given an effect of 'Inadequate telephone system', a sub-cause may be 'Insufficient lines', but 'Dissatisfied staff' is a knock-on effect.
Ways of finding more causes include:
-
Keep asking 'Why?'. A popular phrase is, 'Ask Why five times'.
-
Look at the diagram without talking. Look for patterns.
-
Take a break. Do something to take your mind off your current line of thought.
-
Involve other people, especially those who have expertise in the problem areas.
-
Leave the chart on the wall for a few days to let ideas incubate and encourage passers-by to contribute.
If the diagram becomes lop-sided or cramped, you may want to reorganize the diagram with different major ribs.
- Discuss why the found causes are there. Look for and circle key causes which require further attention. Avoid having too many key causes, as this may result in defocused activities. If there is no clear agreement, use a Voting system.
- Consider the key causes again. Are any more important than others? If so, put a second circle around them, or put numbers next to them to show their relative priority.
- If necessary, gather data to confirm key causes are real, and not just assumed. Repeat the process as necessary.
- Plan and implement actions to address key causes.
<-- Previous |
Next -->
|