Force Field Diagram: Practical variations
The Quality Toolbook >
Force Field Diagram > Practical variations
When to use it | How to understand it |
Example | How to do it | Practical
variations
<-- Previous |
Next
-->
Practical variations
- Line length enables a variable force to be shown, but may be impractical if other variations are used which redirect the line. In this case, show the size of each force with graphical methods other than length, such as color, thickness, numbering, etc.
- Show the size of each force with a number. This may be derived from using tools such as a Prioritization Matrix or Voting. The total force on each side can now be easily summed.
- If some forces are clear and provable and some are based more on intuition or opinion, then mark these differently. For example, circle the well-understood forces.
- The forces can be shown pointing up and down, although this makes the horizontal text more difficult to fit, and can also give an impression of the force going down having the effect of 'gravity', giving it more weight.
- Arrows can be drawn going away from the line, to illustrate forces pulling against one another rather than pushing against one another. This may be more illustrative in some situations, for example where two groups are trying to do different things.
- If a force acts directly against a force on the other side, illustrate this by pointing the arrows against one another, as in
Fig. 1. There will tend to be clusters of arrow heads around key decision points, which may be discussed and resolved individually.
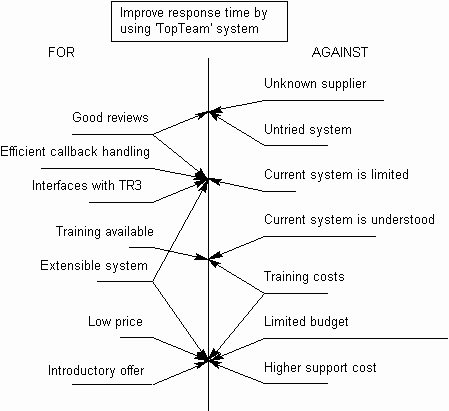
Fig. 1. Showing opposing forces
- Write forces on 3" x 5" cards or adhesive memo notes to allow them to be rearranged while building the diagram. This is particularly useful if showing opposing forces or hierarchies as above.
- Draw the diagram as a see-saw, with stronger forces being shown further from the fulcrum. This can be helped by first sorting forces on each side into order of strength.
- Show how forces are built up with a hierarchy, as in the illustration. Where forces in the hierarchy are given numerical force values, the number for the main force may be determined by summing its contributory forces. This is effectively combining the
Cause-Effect Diagram with the Force-Field Diagram.
This may be combined with the method shown in Fig. 2. to show relationships both within and between forces for and against the argument.
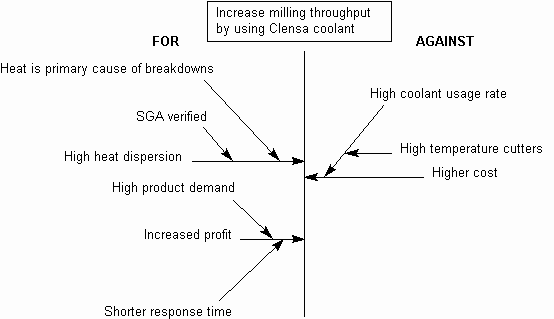
Fig. 2. Combining with cause-effect diagramming
- Where relations between driving and restraining forces are very intermingled and it is difficult to put them on either side of a line, build a Relations Diagram, and mark the forces with positive and negative numbers.
<-- Previous |
Next
-->
|


